Moving Beyond Spreadsheets: A New Era for IFRS 9 Expected Credit Loss Compliance
How banks are transforming their ECL processes from manual burden to strategic advantage
When IFRS 9 took effect in 2018, it fundamentally changed how banks account for credit losses. The shift from incurred loss to expected credit loss (ECL) represented the most significant accounting transformation in a generation. Yet years later, many institutions still struggle with the operational reality of this standard—the data requirements, the model governance, the sheer complexity of moving from a backward-looking to a forward-looking framework.
The journey from raw customer data to final regulatory submission follows two distinct phases: Assessment and Calculation. Understanding the separation between these phases—and how modern platforms handle each—is key to moving beyond spreadsheet-dependent compliance.
Part 1: The Assessment Phase


From Raw Data to Risk Intelligence
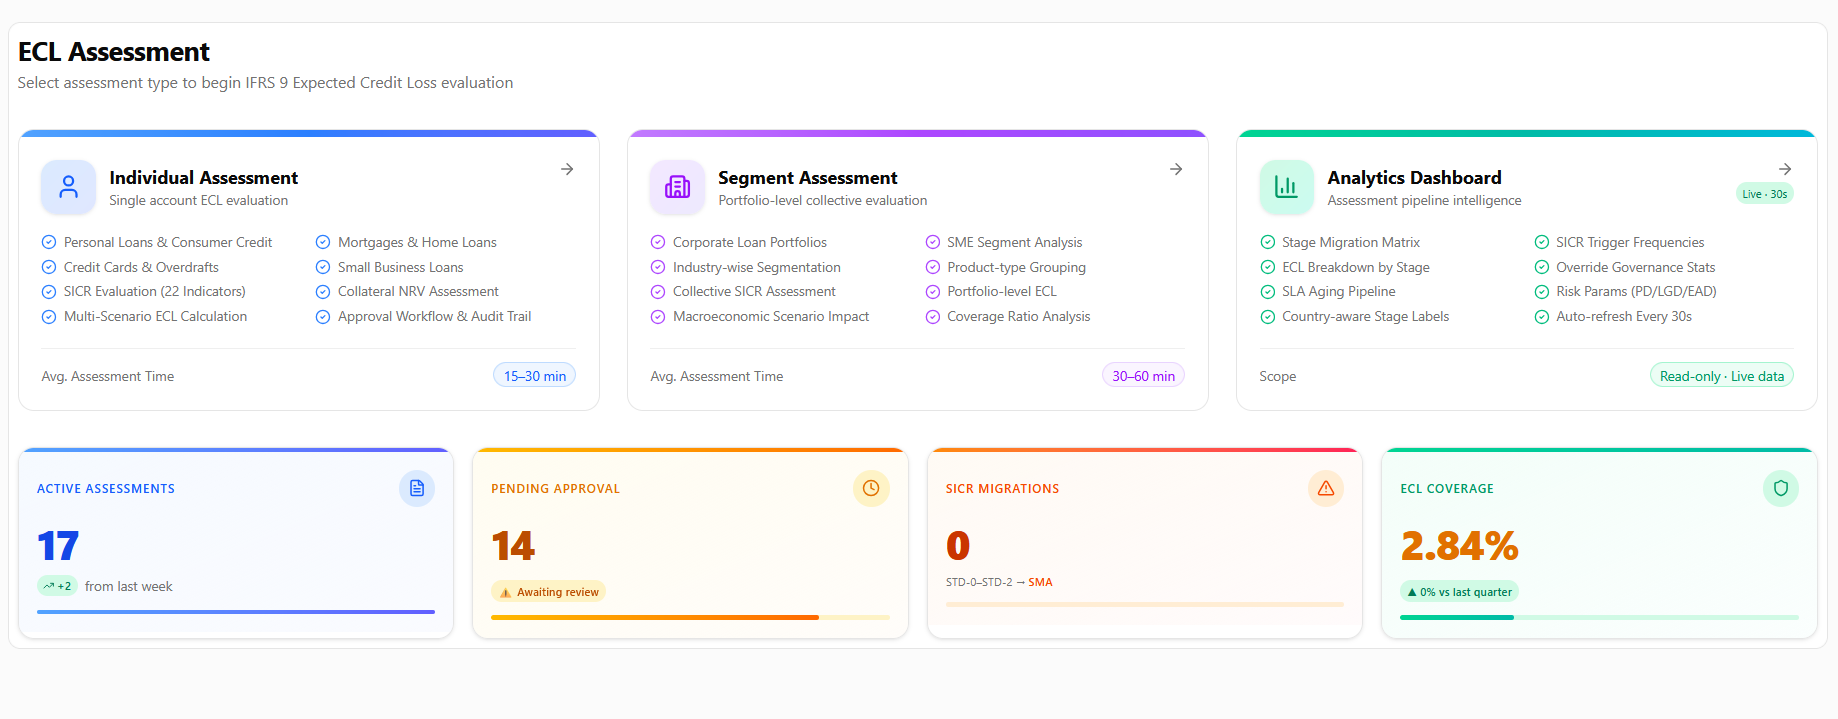
The assessment phase is where credit risk professionals interact most with the system. Its purpose is to evaluate the credit risk profile of individual loan accounts by collecting, scoring, and analysing all relevant data. Assessment answers a fundamental question: Has credit risk increased significantly since initial recognition, and what does that mean for staging?
Starting with Clean Data
Every assessment begins with data. In traditional environments, this means manual transcription from core banking systems—customer names, outstanding balances, collateral details, payment histories. A single assessment can require hours of data entry before any analysis begins.
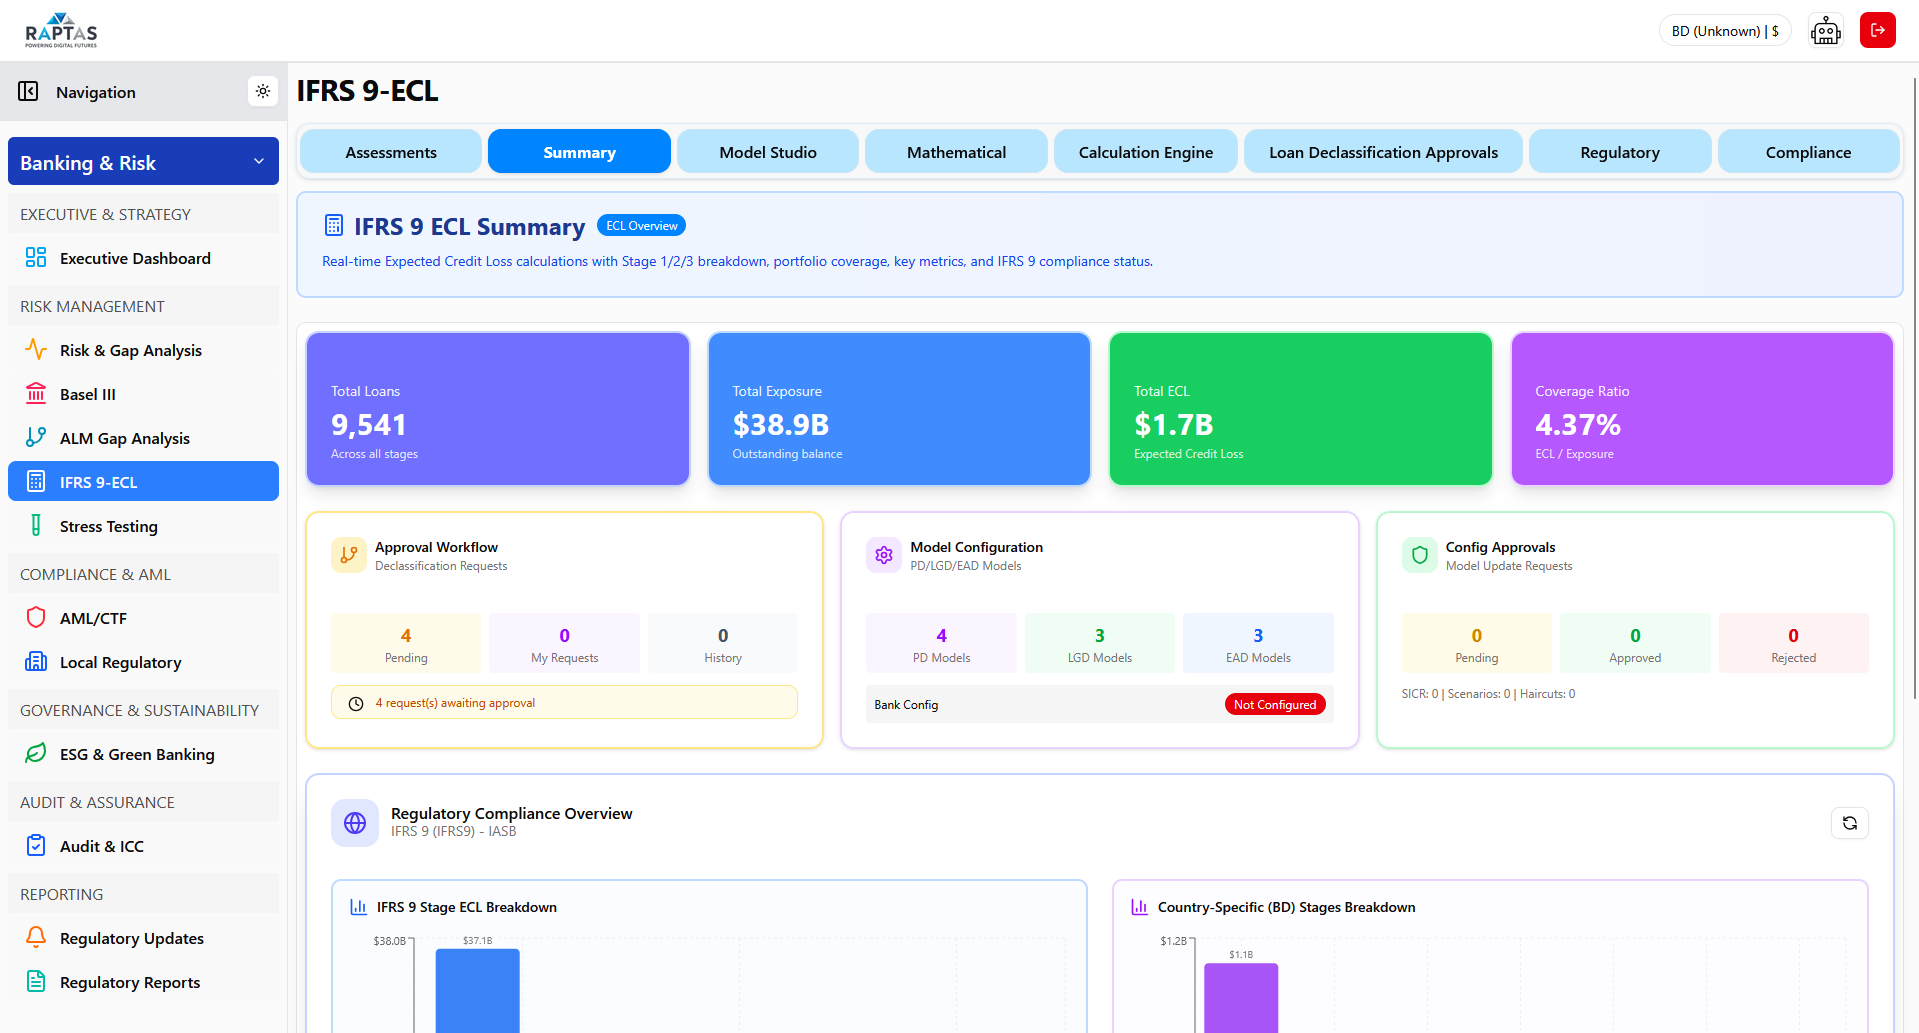
Modern platforms eliminate this entirely. When a credit officer selects a loan account, the system automatically pulls customer information, account details, collateral registers, payment history, and financial indicators. Assessment metadata is auto-generated. The correct regulatory framework loads automatically based on jurisdiction. For a bank in Bangladesh, this means BRPD-15 stage classifications and DPD thresholds apply from the start.
Zero manual data entry eliminates transcription errors. Credit officers see the complete loan picture before beginning analysis.

SICR Evaluation—The Heart of IFRS 9
Significant Increase in Credit Risk determination under paragraphs 5.5.9 through 5.5.11 is the most critical step in the assessment. It governs whether an exposure should be classified as Stage 1 (12-month ECL), Stage 2 (lifetime ECL), or Stage 3 (credit-impaired).
A robust SICR framework considers all reasonable and supportable information—not just days past due. Modern platforms structure this through comprehensive indicator sets:
Quantitative indicators capture hard metrics: days past due trends, PD changes since origination, credit rating downgrades, profitability declines, leverage increases, liquidity stress, collateral value erosion, payment behaviour patterns, account conduct, and exposure growth.
Qualitative indicators address softer factors: industry distress, macroeconomic stress, management quality, business model changes, legal and regulatory risk, geographic exposure, currency risk, ownership changes, group contagion, restructuring history, forbearance status, and ESG considerations.
Each indicator carries a defined weight. The system computes a total quantitative score, total qualitative score, and combined SICR score. If the combined score exceeds the configured threshold, SICR is triggered and the exposure moves to Stage 2.
Stage classification can be determined through multiple methods:
| Method | Approach |
|---|---|
| DPD-Based | Pure days-past-due thresholds per country regulation |
| PD Threshold | Stage 2 triggered if PD change exceeds relative or absolute threshold |
| Qualitative | Scoring across payment, financial, collateral, and external dimensions |
| Combined | Uses highest stage from all three methods—most conservative |
The result is a quantified, auditable SICR determination that replaces subjective judgment with systematic analysis. Twenty-two documented factors ensure regulatory defensibility under IFRS 9's requirement that "all reasonable and supportable information" be explicitly considered.
Delay Analysis
Days past due analysis provides detailed insight into payment delinquency patterns. A structured framework examines minor delays under 30 days, watch-level delays of 30 to 60 days, SMA-level delays of 60 to 90 days, default-level delays over 90 days, recurring delinquency across multiple cycles, payment plan adherence for restructured terms, and root cause analysis distinguishing willful default from circumstantial events.
Country-specific DPD thresholds apply automatically. Under Bangladesh BRPD-15, Stage 1→2 triggers at 0 DPD, while Stage 2→3 triggers at 90 DPD. Under standard IFRS 9, Stage 1→2 triggers at 30 DPD with Stage 2→3 at 90 DPD.
Forward-Looking Information
IFRS 9 paragraph 5.5.17 requires incorporating forward-looking macroeconomic information into ECL estimates. Three standard scenarios provide the foundation: a baseline scenario representing most likely economic conditions, an optimistic scenario, and a pessimistic scenario.
Each scenario applies multipliers to risk parameters. A pessimistic scenario might increase PD by 30%, LGD by 15%, and EAD by 5%. The probability-weighted ECL becomes the weighted sum across all scenarios, with typical weights of 50-60% for baseline and 20-25% for each alternative scenario.
Scenario comparison views show variance from baseline and stress sensitivity ratios, enabling board-level reporting: "Under our pessimistic scenario, ECL increases by 28%, driven primarily by SME exposure."
Collateral Valuation
Collateral valuation has long been a weak point in credit assessment. A methodical Net Realizable Value approach replaces subjectivity with a structured cascade:
Starting from gross appraised value, the system applies adjustments for market conditions, age and condition, location factors, liquidity discounts, forced sale discounts, legal and transfer costs, selling and marketing expenses, maintenance and holding costs, prior claims and liens, insurance recovery, time value discounting, and regulatory haircuts mandated by the central bank.
| Collateral Type | Typical Haircut Range |
|---|---|
| Cash and equivalents | 0-5% |
| Government securities | 5-10% |
| Residential property | 20-40% |
| Commercial property | 25-50% |
| Equipment and machinery | 40-60% |
| Inventory | 50-70% |
| Receivables | 30-50% |
Each step is documented, each adjustment justified. The result: collateral valuations that withstand regulatory examination and provide confidence in LGD estimates.
ECL Preview and Stage Classification
Based on all data collected, the system generates an initial ECL estimate and recommended stage classification. This includes stage-specific ECL previews (12-month for Stage 1, lifetime for Stage 2, credit-impaired for Stage 3), suggestive PD values generated by scoring models using CBS data and SICR results, core formula preview using PD × LGD × EAD, regulatory floor checks against minimum requirements with exact shortfall amounts flagged, and real-time recalculation on every parameter change.
For banks without pre-existing PD models across all portfolios, the suggestive PD values generated from scoring models provide immediate, calibrated PD for every assessed account.
The relationship between suggestive PD, stage determination, and ECL outstanding can be summarised as follows:
| Factor Score Range | Suggestive PD (Pre-Floor/Cap) | Stage Determination | ECL Outstanding (Illustrative) |
|---|---|---|---|
| 85–100 | 0.03% – 0.50% | Stage 1 (12-month ECL) | EAD × 12-month PD × LGD |
| 70–84 | 0.51% – 2.50% | Stage 1 (if SICR not triggered) | EAD × 12-month PD × LGD |
| 70–84 | 0.51% – 2.50% | Stage 2 (if SICR triggered) | Σ EAD × Lifetime PD × LGD (over remaining life) |
| 50–69 | 2.51% – 10.00% | Stage 2 (presumptive) | Σ EAD × Lifetime PD × LGD (over remaining life) |
| 30–49 | 10.01% – 30.00% | Stage 2 / Stage 3 boundary | Σ EAD × Lifetime PD × LGD or credit-impaired calculation |
| Below 30 | >30.00% | Stage 3 (credit-impaired) | EAD × 100% × (LGD × downturn uplift) |
Note: The suggestive PD derived from the 8-factor scorecard is combined with SICR indicator results to determine final stage classification. Actual ECL calculation methodology varies by stage as shown above.
Final Review and Recommendations
The comprehensive assessment summary includes ML-driven recommendations across key dimensions: SICR analysis highlighting triggered indicators, DPD analysis confirming stage thresholds, collateral coverage warnings, provision adequacy alerts against regulatory minimums, stage migration impact showing P&L effects, scenario sensitivity analysis, override detection requiring justification, regulatory compliance status, and data completeness checks.
Each recommendation includes priority level and actionable next steps.
Assessment Approval
Upon completing all steps, the assessment enters the approval workflow. The 4-eye principle is enforced throughout—no assessment can be approved by its creator. Role-based routing directs assessments to appropriate approvers based on stage, amount, and risk level.
Part 2: The Calculation Phase
From Approved Assessments to Definitive ECL
The calculation phase takes approved assessment outputs and computes the definitive Expected Credit Loss using bank-configured models, approved parameters, and regulatory rules.
This phase operates on a fundamental architecture principle: Separation of Concerns. Model configuration is distinct from calculation execution. This ensures governance between those who set parameters and those who run calculations.
The Configuration Foundation
Before any calculation can run, the bank must configure its risk parameters in a unified workspace covering all components:
| Component | Configuration Scope |
|---|---|
| PD Models | Per rating grade, segment, industry—scoring models, rating scales |
| LGD Models | Per segment, collateral type, seniority—base LGD, downturn LGD |
| EAD Models | Per product type—fixed CCF, regression, lookup tables |
| SICR Criteria | Threshold rules, DPD triggers, qualitative score thresholds |
| Macro Scenarios | Baseline/adverse/severe with economic forecasts |
| Collateral Haircuts | Institutional discount rules per collateral type |
| CCF Configuration | Credit Conversion Factors per product and facility type |
All parameters are managed through approval workflows. Every change is recorded with timestamp, user identity, and comments. Parameters cannot be used in production until approved by designated approvers.
The Parameter Resolution Engine
When an ECL calculation is triggered, the backend parameter resolver automatically loads bank configuration, applies SICR criteria to determine stage classification per exposure, applies collateral haircut configurations for adjusted LGD, resolves applicable Credit Conversion Factors per product type and maturity bucket, and computes final EAD incorporating drawn amounts, undrawn commitments, and accrued interest.
The resolver works across all calculation modes—individual, portfolio, and segment—ensuring every calculation consumes all configured components without manual parameter threading.
Four ECL Calculation Methods

Different portfolios require different calculation approaches:
| Method | Approach | Best For |
|---|---|---|
| Standard | Deterministic PD × LGD × EAD | General-purpose IFRS 9 compliance |
| Simplified | Provision rate matrix | Banks aligned to BRPD-14/15 guidelines |
| Monte Carlo | Stochastic simulation | Model validation and stress testing |
| Advanced | Multi-period term structure | Long-tenor corporate and project finance |
Standard Method
For Stage 1, ECL equals EAD multiplied by 12-month PD multiplied by LGD multiplied by discount factor. For Stage 2, ECL is summed across all periods to remaining maturity with EIR-based discounting. For Stage 3, PD is set to 100% and LGD receives downturn uplift capped at 100%.
Simplified Method
This regulatory-aligned approach applies pre-defined provision rates based on PD severity buckets rather than computing ECL from PD × LGD × EAD directly.
| Stage | PD Bucket | Provision Rate |
|---|---|---|
| Stage 1 | Minimal to elevated risk | 0.25% to 2.00% |
| Stage 2 | PD ≤ 20% to PD > 50% | 5.00% to 20.00% |
| Stage 3 | LGD < 75% / LGD ≥ 75% | 50.00% / 100.00% |
Monte Carlo Method
PD and LGD are sampled from statistical distributions for thousands of iterations. Each iteration calls the Standard method with freshly sampled parameters. The final ECL equals the mean across all iterations, with confidence intervals provided. This captures the full probability distribution of credit losses.
Advanced Method
For sophisticated portfolios, marginal PD per period is derived from 12-month PD using hazard-rate decomposition. Vintage-adjusted LGD increases over time reflecting collateral depreciation. EAD follows an annuity-style declining balance. Stage 3 models time-varying recovery processes.
Portfolio Batch Calculation
For quarterly provisioning and regulatory reporting, the platform processes entire portfolios through a structured workflow:
Scope selection defines the portfolio segment, date range, and calculation mode. Model assignment applies configured PD, LGD, and EAD models to the scope. Parameter resolution validates all parameters via the resolver engine. Stage classification applies SICR methods consistently across all exposures. Calculation executes with real-time progress tracking and parallel processing handling hundreds of thousands of exposures. Scenario weighting applies probability-weighted scenarios for final ECL.
Each batch run produces aggregate ECL totals, stage distribution counts, period-over-period comparisons, regulatory adequacy checks, and per-account exports for audit trails.
Interest Revenue Recognition
Under IFRS 9 paragraphs 5.4.1 through 5.4.2, interest revenue is calculated differently by stage. For Stage 1 and Stage 2, interest revenue equals EIR multiplied by gross carrying amount. For Stage 3, interest revenue equals EIR multiplied by net carrying amount after ECL deduction. The platform enforces this distinction automatically.
From Calculation to Reporting
The ECL calculation feeds directly into regulatory reporting. CL forms generate from CBS data in seconds rather than days. EDW uploads include complete audit trails. Fifty-seven inbuilt report templates cover capital adequacy, liquidity, credit risk, AML/CFT, governance, and ESG.
Scheduled reporting with automated delivery via email, FTP, or REST API removes the last manual touchpoints from the compliance chain.
The Value of Separation
Understanding the distinction between assessment and calculation reveals why modern platforms outperform spreadsheet-based approaches:
| Phase | Traditional Approach | Modern Platform |
|---|---|---|
| Assessment | Subjective judgment, manual data entry, inconsistent SICR | Structured framework, CBS auto-population, guided workflows |
| Configuration | Scattered spreadsheets, version control issues | Centralised workspace, approval workflows, audit trails |
| Calculation | One-size-fits-all formulas, manual batch runs | Multiple methods, automated processing, scenario weighting |
| Reporting | Manual compilation, last-minute rush | Automated generation, scheduled delivery |
The separation ensures governance while maintaining connected systems with shared data and complete audit trails.
Moving Forward

The banks that thrive under IFRS 9 will be those that treat compliance not as a burden to be minimised but as a capability to be mastered. They will build systems that transform raw CBS data into auditable risk parameters, that replace subjective judgment with quantified indicators, that automate regulatory reporting while maintaining complete governance.
They will move beyond spreadsheets—not because spreadsheets are inherently bad, but because the complexity of modern credit risk demands better. They will recognise that in an era of expected credit losses, the greatest risk is relying on tools designed for a simpler time.
The technology exists today. The question facing every bank is not whether to transform, but when.
This article draws on implementation experience with financial institutions across multiple jurisdictions, including banks navigating both IFRS 9 and local regulatory frameworks. The insights reflect patterns observed across successful ECL transformations—institutions that moved from manual processes to integrated platforms and captured the full value of the transition.